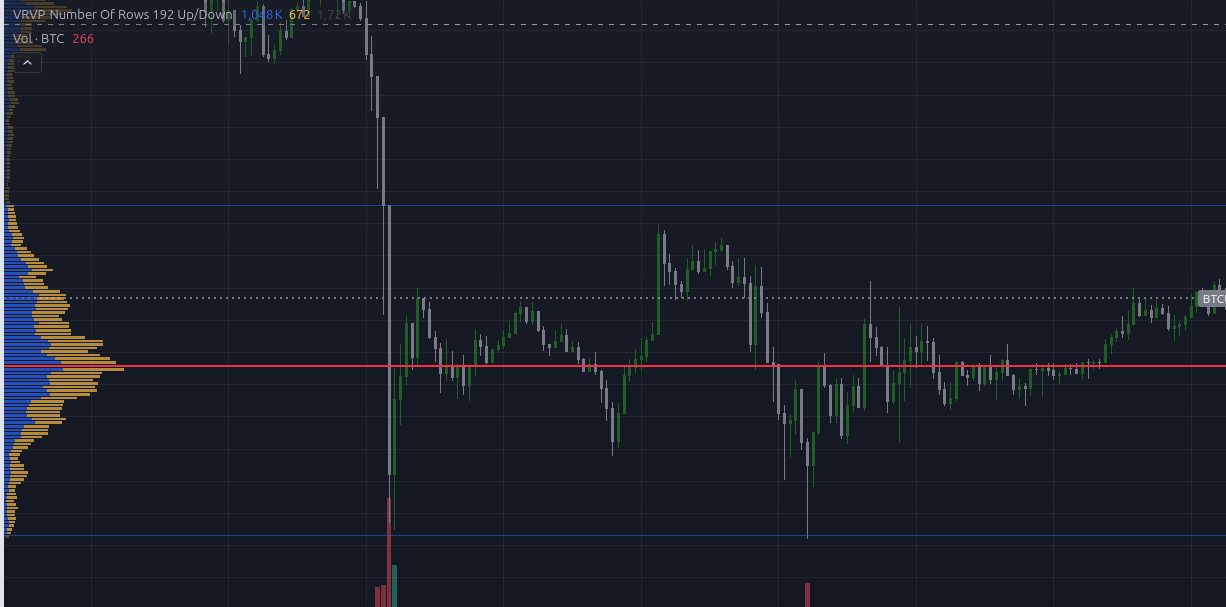
The Visible Range Volume Profile (VRVP), also known as the Volume Profile Visible Range (VPVR), is a popular technical analysis tool used by traders to analyze price levels based on volume. It provides a detailed view of the volume traded at specific price levels within a visible portion of the chart. Here's how to interpret the Visible Range Volume Profile:

¶ 1. Volume Bars (Histogram)
- Horizontal Bars: The VRVP shows horizontal bars that represent the volume traded at specific price levels within the visible range of the chart.
- Longer Bars: Indicate higher trading volume at that price level, suggesting it is a significant area of interest.
- Shorter Bars: Indicate lower trading volume, suggesting less interest in that price level.
¶ 2. Key Levels
- Point of Control (POC): The price level with the highest traded volume within the visible range. This is often considered the most important level, as it indicates where the majority of trading activity has occurred.
- High Volume Nodes (HVN): Areas where there is a cluster of long volume bars. These levels often act as support or resistance, as they represent significant interest from traders.
- Low Volume Nodes (LVN): Areas with short volume bars. These levels can indicate potential areas for price movement, as there is less interest or consolidation at these levels.
¶ 3. Support and Resistance
- High Volume Areas: Often act as support or resistance. If the price approaches a high-volume node from below, it may face resistance, and from above, it may find support.
- Low Volume Areas: Tend to act as zones where price moves quickly through, often leading to breakouts or sharp movements.
¶ 4. Trend Analysis
- Balanced Profile: When the volume profile is more or less balanced with a prominent POC in the middle, it suggests a range-bound market with potential for sideways movement.
- Unbalanced Profile: A profile with volume concentrated at one end can indicate a trending market, where the price is more likely to move in the direction of the imbalance.
¶ 5. Price Rejection and Acceptance
- Rejection: Price may quickly move away from low-volume areas, indicating rejection of those levels.
- Acceptance: Price tends to spend more time at high-volume areas, indicating acceptance of those levels as fair value.
¶ 6. Combining with Other Indicators
- VRVP is often used alongside other technical indicators like moving averages, RSI, or MACD to confirm trends or potential reversals.
By analyzing these elements, traders can make informed decisions about potential entry and exit points, anticipate market reactions at key price levels, and understand the underlying market sentiment within the visible range of the chart.